Powerarena
Human Performance, AI Enhanced
Enhancing the root-cause analysis flow for the Industrial Engineers
Project Info
Role
UX Research, UI Design, Design System
Platform
Desktop and Mobile Version

Overview
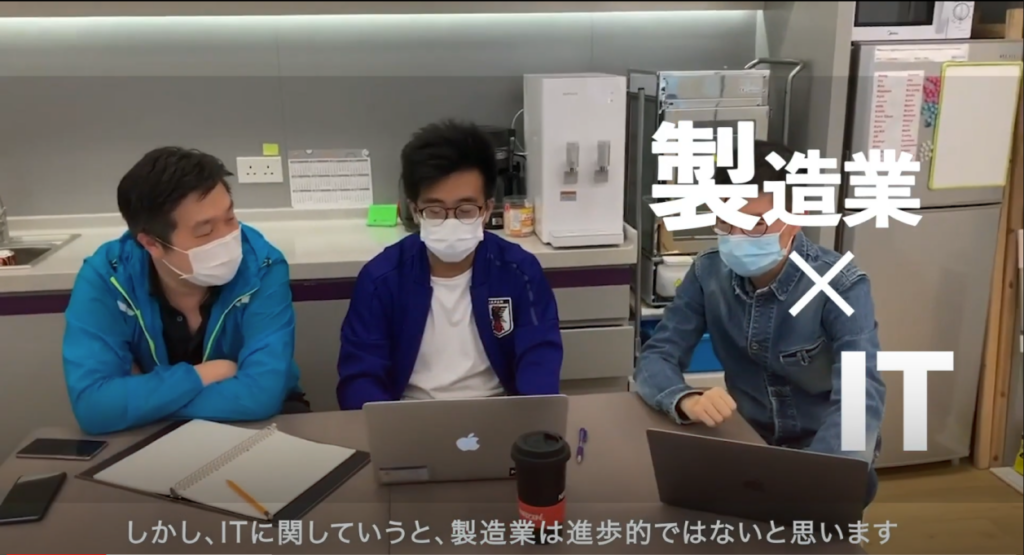
PowerArena applies machine learning and computer vision to digitize the physical world. Committed to taking human understanding of real-world engineering to new levels of efficiency and it helps you to make better decisions simply by giving you more accurate information. Industrial engineers (IE) are using PAs AI technology on assembly lines to achieve smart manufacturing and manufacturing digitalisation.
My Role
During my time as a UX Designer for PowerArena, I am responsible for defining the real problem and designing the final visual crafts of PowerArena. I work closely with the CEO, CTO, machine learning engineers, Data Scientists, UX Lead and Sales to produce meaningful work for business direction.
Outcome
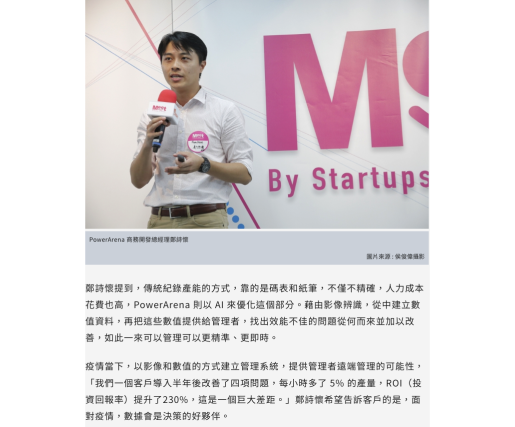
In the first six months after purchasing our product, the client has adjusted their problem and improved the assembly line's efficiency. There was a growth of 5% in their assembly line's output and a 230% increase in their return on investment. In addition, we've received a lot of positive feedback from IE about our UX
Product Problem
According to the IEs, Powearena is unable to figure out the Root Causes of assembly lines and workstations because snapshots, livestreams, and reports provide no insight.
LiveStreaming
Industry engineers (IE) is unable to identify the problem through livestream due to:
1. They cannot trace back the problem through livestream because it has already happened
2. To figure out the root-cause of the problem, IE needs to check all the related workstations one by one
Snapshot
IE cannot get the full picture based on snapshot(s) provided.
Analyst Report
There is not enough information in the report, so they cannot gain any insight from it. As a result, they prefer to have our data analyst create their reports.
Industry engineers (IE) s ’ Problem
Due to PA's inability to integrate with IE's daily work, they prefer to read the data analyst's reports instead of using PA.
There is a need for more customization and information about each workstation, such as the camera status, the accuracy of each workstation, and information about its setup
Reframe the Problem
How might we redesign the Root-Cause Analysis flow as a seamless experience that gives Industrial Engineers sufficient data to identify the bottlenecks and effectively form an improvement plan?
Research Objectives
- Understand IE’s difficulties and further needs when using PA.
- Understand IE’s daily work routine and their painpoint.
- Uncover IE insights of areas for improvement
Project Objectives
- Enhancing the root-cause analysis for the Industrial Engineers in Electronics Factory.
- Redesign the website in future-proof and scalable way.
- PA’s function can be integrated into their daily work smoothly
Picking up the pieces
I did not have a clear mission or specific goals when I joined Powerarena for the redesign of the PA Product.
To get my first idea, I decided to use the following method without any prior A.I knowledge.
Application review
Reviewing the current application and the purpose of the existing function.
Stakeholder Interview
Understanding the business's aims and the way it operates by conducting stakeholder interviews, including that of the CTO, the developer, and the data analyst.
End User interview
Conducting user interview in various industries / remotely to understand our user need.
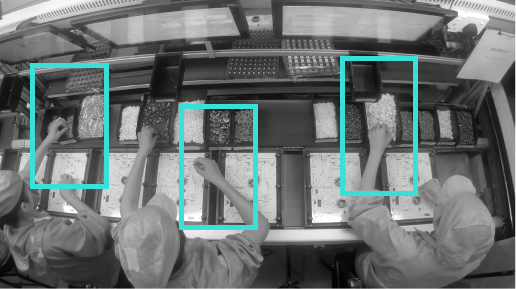
Onsite observation Review
For a better understanding of their operation and to see how our camera and coming design can adapt to their production line. During our trip to the mainland, our team observes the real assembly line operation in different electric industries.
Empathises
Discover IE’s painpoint and feedback on the product
In order to identify the core problems and understand the pain points, I conducted simultaneous user interviews on the mainland and remotely. Getting a sense of how our users interact with our product.
My Research plan focus on these area:
- What are the end user’s key activities?
- What are their difficulties in their day-to-day activities?
- What are the biggest pain point of the assembly line?
- What kind of data do they need to know?
- Who do you interact with?
- What do they expect PA can help?
The followings are what I learned:
<span data-metadata=""><span data-buffer="">「I have no familiarity with Power Arena's features and feel disoriented using it」
- “Powerarena only provides screenshots and live-streaming. However, these function is unable to figure out any issue”
- “For the data report, it is lack of sufficient evidence to explain the assembly line situation, so I can only read the data from your Data Analysis “
- “I am too busy with my work and unable to check the assembly line and workstation one by one “
Define
Define the problem after user research and secondary research, and then prioritize the problem.
The target user in this scope needs to be identified and their problems and needs need to be addressed.
After interviewing all the IEs, I have created a user profile so that everyone is on the same page.

Ar Yan | Industrial engineer ( IE )
A Yan is an IE who is full of enthusiasm and energy. She works in an electronics factory, designing the entire assembly line process and continuously improving it. A Yan desperately needs accurate reports to improve the assembly line. In case of a problem, she can go to the assembly line. The factory manager must be notified in the morning and at the end of the day.
Design Opportunities
- Provide real time alert / status of each workstation for the IE.
- IE also need to keep tabs on the whole assembly line when there is a problem at the first moment.
- Provide sufficient and useful information
- Provide more Clues like video playback / Related workstation
- Allow for multiple workstation creation and control in one go
Ideate
After defining the problem, time to brainstorm product direction and feature.
I have discussed with my UX lead the new direction of the design principles gathering the insight from the define stage.
Design Opportunities
<span data-metadata=""><span data-buffer="">Clear and Simple UI
- Conducting user interview in various industries / remotely to understand our user need.
Focus the needs and problem on IE strategically
- The problematic clips can be recorded through the AI camera and they are sorted out according to the severity. The reason for the problem can be added to the report and view related workstations at the same time in order to help analyze and report.
- Card design is used to represent the workstation, and we put all the necessary information on the card for the user to understand. Additionally, the user can be reminded of the next step.
Focus the needs and problem on IE strategically
- Use the terms that IE should know
- The terms in Mainland and Taiwan is different
Consolidate the idea of entire product
Using the previous analysis, character history, jobs to be done, and the business strategy, we have consolidated the idea. Our design goals, directions, etc. can be understood from the user's perspective through this board.
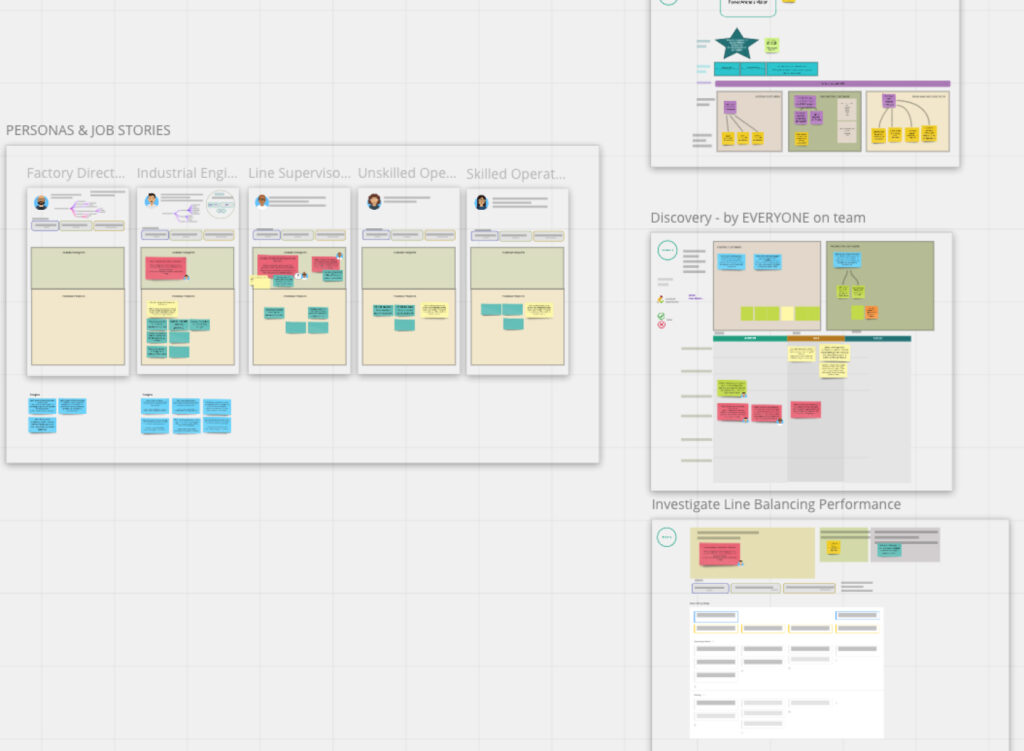
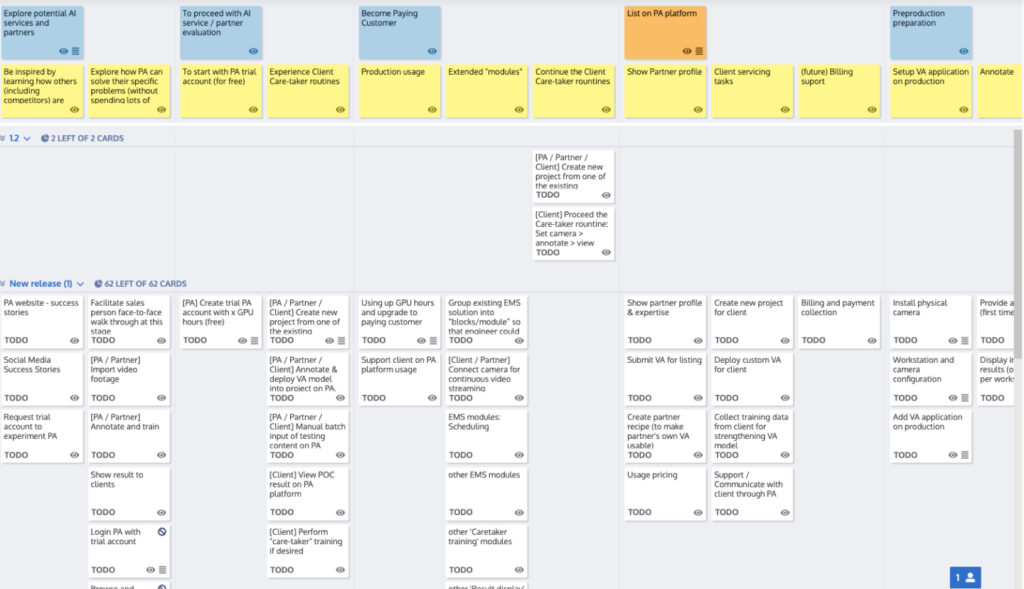
User story Mapping
After analyzing the previous analysis and converting it to user stories, we disassemble the functions at the storyboard.
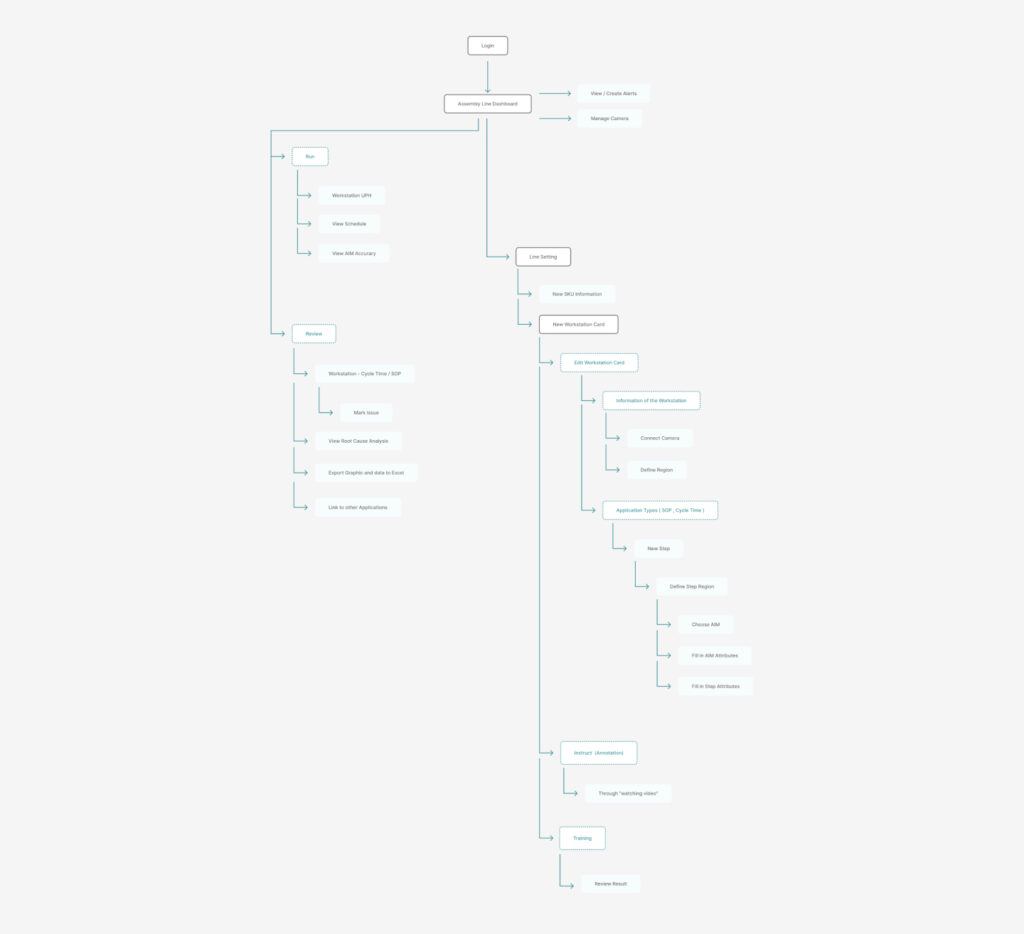
Restructure the Information Architecture
Before I dig into visual design and creating page layout, I tried to figure out what would be the reasonable information architecture that users can easily find their way into the app
Wireframe
Following the completion of the information architecture, I looked at the wireframe on the whiteboard to visualize how each component and visual element should be positioned. I was also able to think about information hierarchy so I could present the content and function more clearly. In order to make the wireframes more concise and align with everyone's expectations, I iterated them with the team.
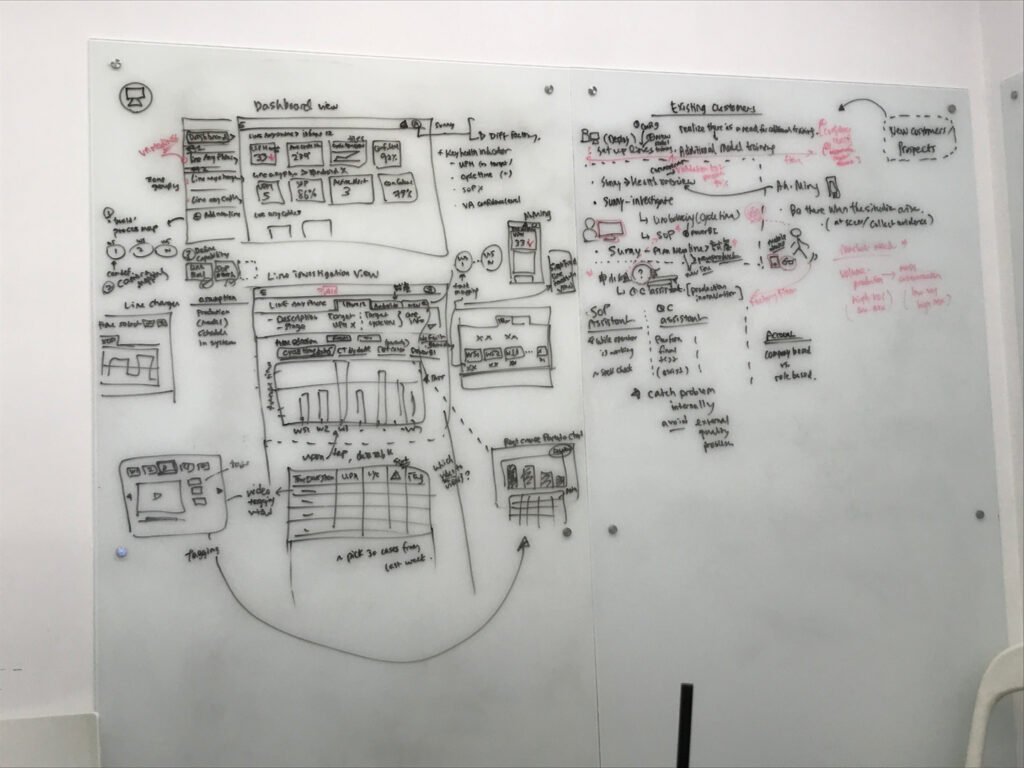
*Cannot share full details due to NDA
I also show the flow and the wireframe, then Working closely with UX Lead, developers and CTO together we brainstormed big ideas, discussed flow, defined technical constraints and headed in a direction.
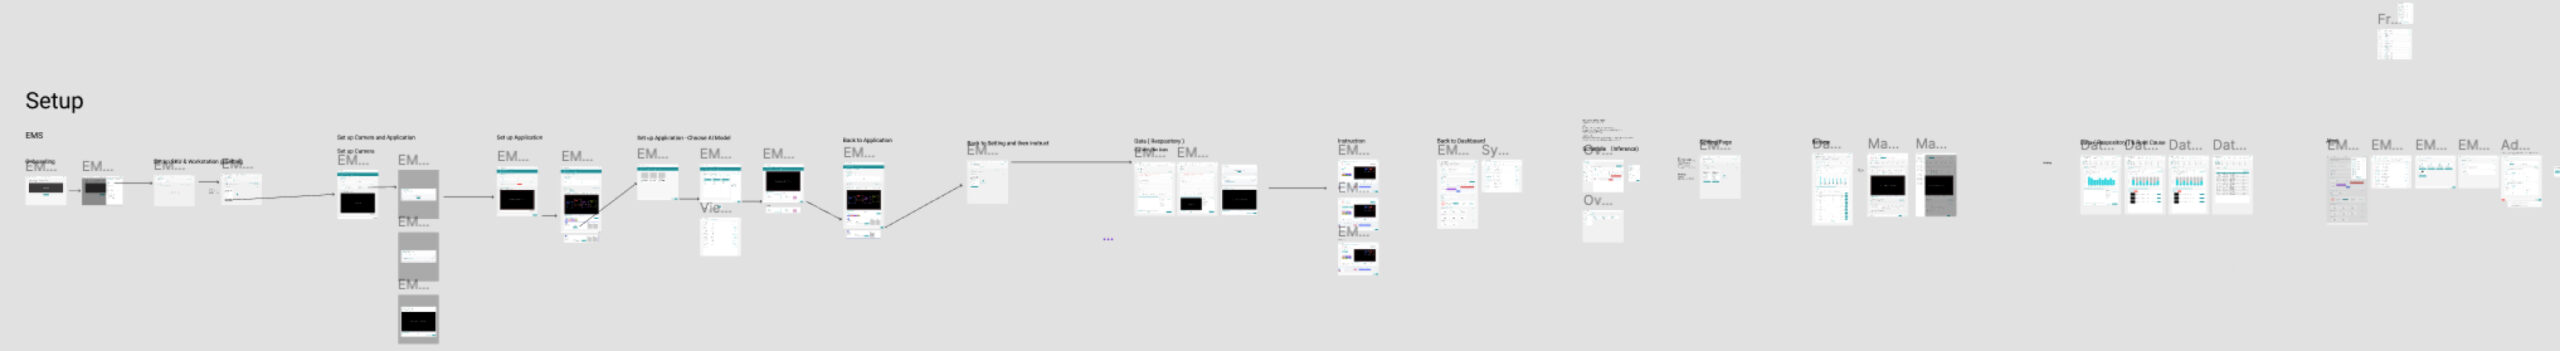
Execute & Design Deliverables
Bringing all the ideas, feedback and suggestions into real product
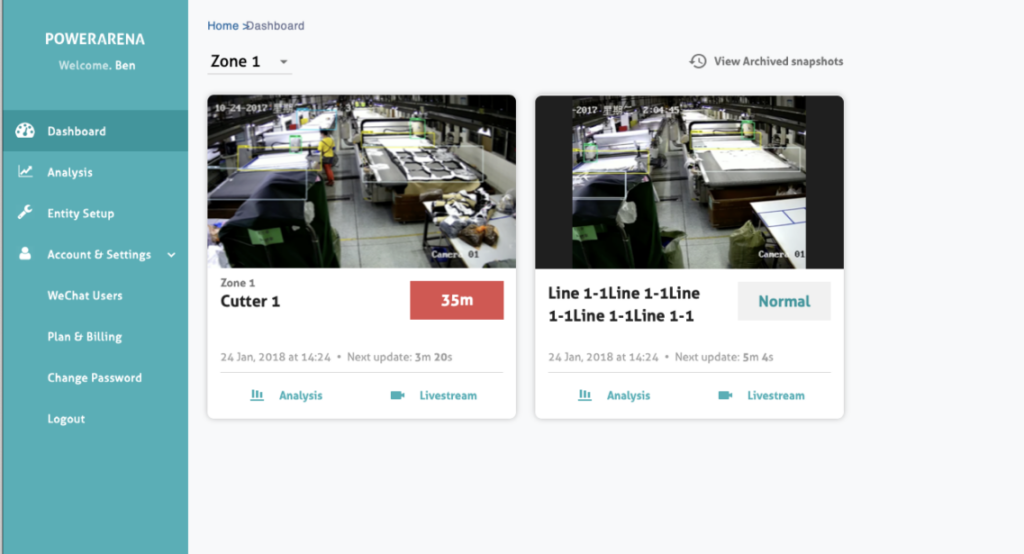
Real time monitoring the situation of each workstation on assembly line
For IE, the problem can be checked in two ways. One is to spend a lot of time watching the videos on the website. The other is to monitor the assembly line by staying around for a long time. IE's work schedule will be affected if he stays on the assembly line. So, we added the "Workstation situation" to provide a different perspective on the real-time situation.
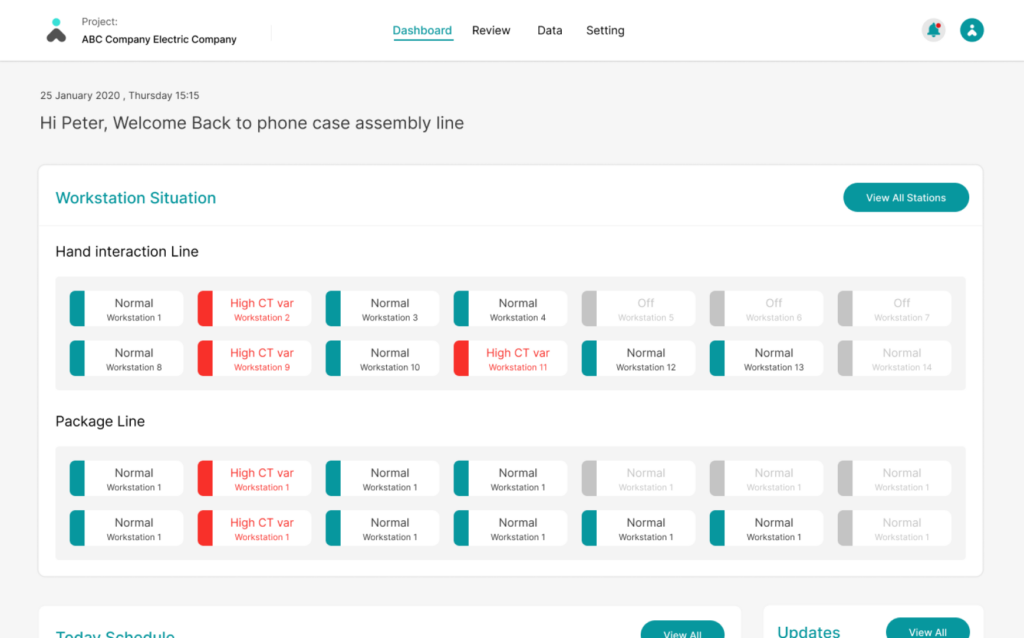
User can click into the worksation based on the different situation, Red means issue occured, Green means normal status
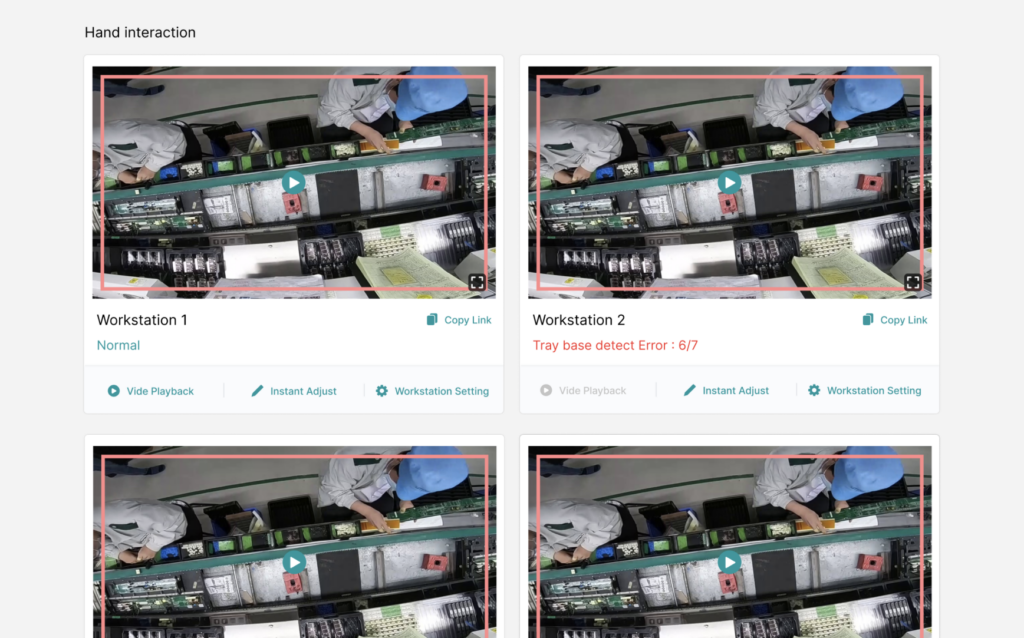
Once user enter the detail view, they can choose replay, live or adjust the workstation
More detailed report and more easy method to trace back to the root cause
Industry engineers must submit reports to the industry's head and find out why they have to improve the production line's efficiency continually. Unfortunately, in the past, Powerarea only showed all the stations. Users need to browse all of them to know to figure out the problem. It takes a lot of time to trace the cause, making it difficult to improve the report and evidence. For this purpose, we have added several report forms that they need most, including Cycle Time, SOP, Root Cause for each line, each SKU, and each station. It is sorted out by severity and allowing users to choose which problem to be solved.
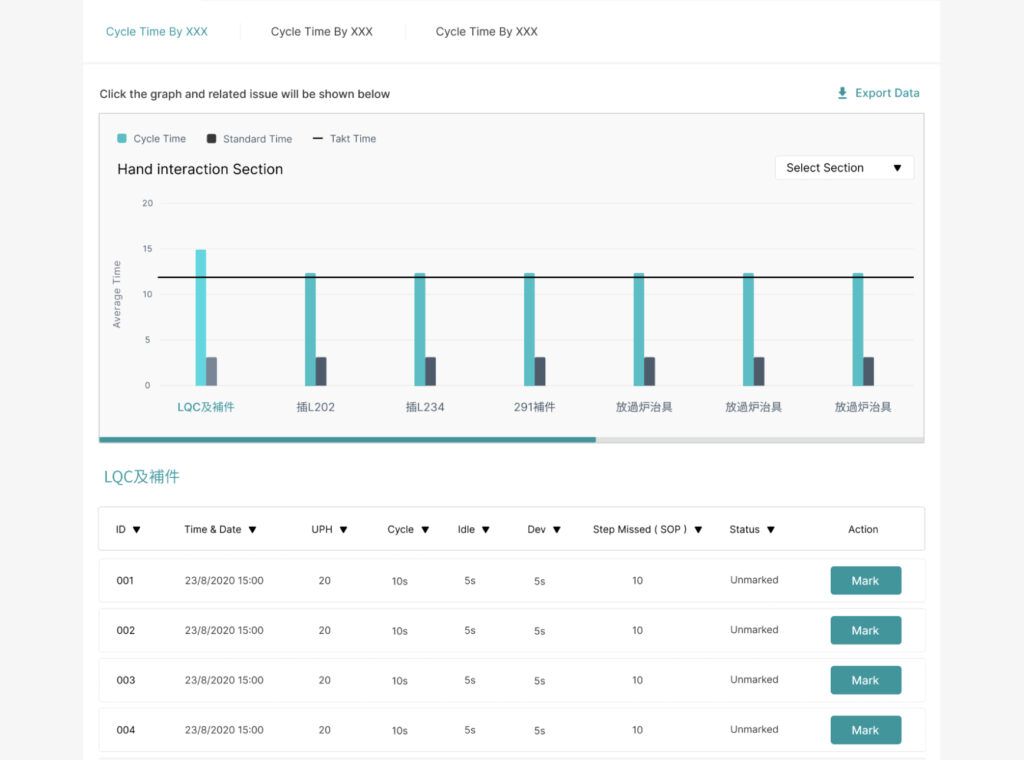
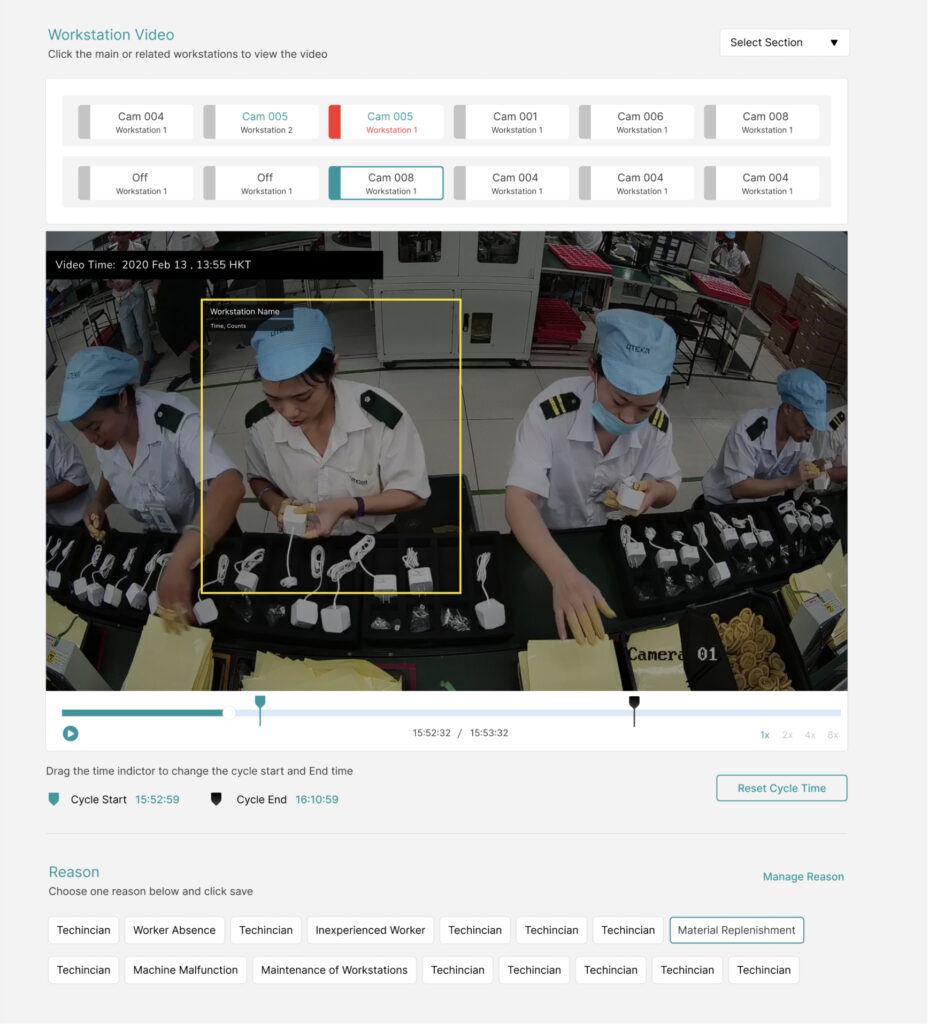
Once you click on the issue from the list, we will provide method to find the main cause of each issue, including the time before and after the incident record data, the time of occurrence, related videos and videos of other stations around the same time. We found that this method speeds up the search for engineers in the industry
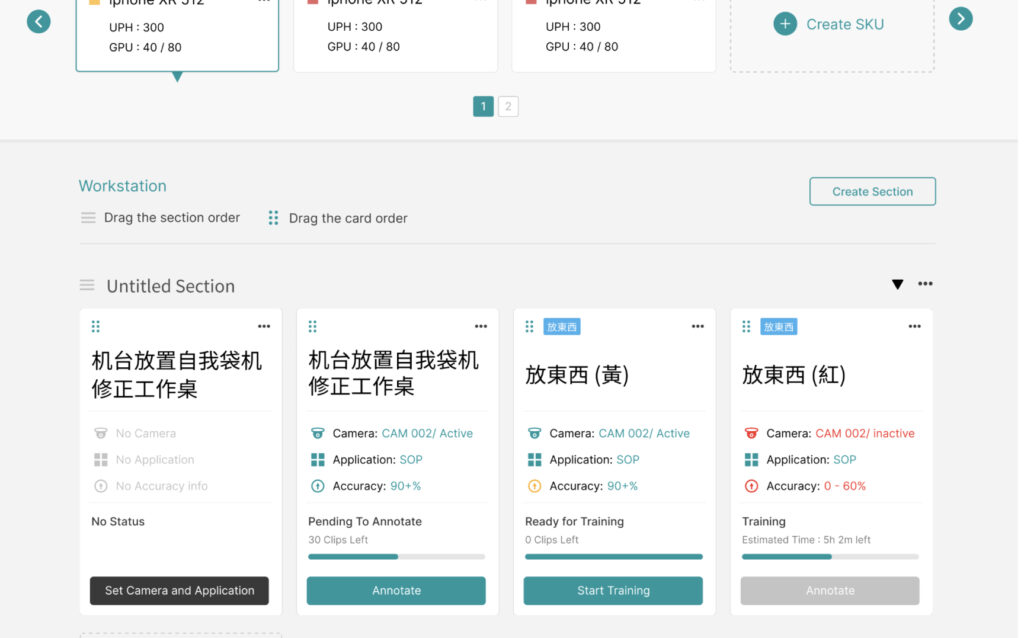
A more Rich and structured information on workstation card
There are many kinds of issues to fix on each workstation; therefore, the design of the workstation card needs to be handled carefully. There may be many types of problems in the future, but we need a clear and high level of flexibility for future extensions. Therefore, we have redesigned the workstation card with a better structure. Our users should be able to understand the current status and next step when viewing the card. Therefore, the details of the camera, the selected application, accuracy and the next step button have been added.
Validate
<span data-metadata=""><span data-buffer="">Validate the design, uncover insights and receive feedback
Feedback on our new prototype
We reached out Our IE in-depth user interviews and usability testing on the prototype
‧ The new prototype is able to provide more useful information
‧ Simple flow and easy to know what kind of problem should be solved according to the priority
Desktop Version
Around 95% of the factories are still using desktop 1024 x 768 as their first priority to do all operation, monitoring and report. They use mobile to receive instance alert. Therefore, our team decide to focus on develop website first. Once we confirm that there is a good result, we can transplant these new changes to other platforms such as the mobile web version